



Supply chain profitability and inventory management rely heavily on the predictability of international shipping schedules. Sea transit remains one of the most variable components of global logistics. Relying on generalized shipping estimates leads to costly stockouts, inflated safety stock holding costs, and missed market opportunities. Decision-makers need precise, route-specific data to build resilient lead times.
Moving from rough estimates to accurate supply chain forecasting requires understanding the distinct phases of sea transit. You must recognize the structural differences between service levels and identify the hidden variables that disrupt schedules. Establishing a reliable baseline for your cargo movements means looking beyond the carrier's published sailing schedule. We need to examine the entire physical journey of your inventory from the factory floor to the final receiving dock.
Key Takeaways
Baseline Averages: While extreme routes can take anywhere from 10 to 55 days, standard international sea transit typically averages 20 to 45 days. However, end-to-end lead times can extend to 60+ days depending on origin and destination.
Service Level Impact: Timelines vary significantly based on whether cargo is routed as Full Container Load (FCL), Less than Container Load (LCL), or Expedited/Express services, with LCL requiring additional days for consolidation and deconsolidation.
Scope of Transit: Evaluating timelines requires distinguishing between terminal-to-terminal sailing days and comprehensive end-to-end delivery schedules.
Risk Mitigation: Proactive planning for peak seasons, customs documentation, and port congestion is critical when evaluating ocean freight shipping services.
Baseline Transit Times for Ocean Freight: Setting Realistic Expectations
Defining what constitutes a transit time is the first step in establishing accurate inventory replenishment cycles. Many shippers confuse vessel sailing time with total supply chain lead time. Sailing time only covers the period the vessel is physically moving across the water. Total lead time includes cargo handover, terminal processing, sailing, customs clearance, and final delivery. To build a functional inventory model, you must measure the entire lifecycle of the shipment.
Global averages provide a starting point for planning. These baselines fluctuate based on weather, port efficiency, and vessel speed, but they offer a reliable framework for forecasting. Standard ocean freight schedules generally fall into predictable regional patterns based on the distance and the specific string of ports the vessel calls on.
Typical Sailing Times by Major Trade Lane
Trade Lane | Origin to Destination | Estimated Sailing Time |
|---|---|---|
Transpacific Eastbound | Asia to US West Coast | 14 – 25 days |
Asia-Europe | Asia to Northern Europe | 30 – 40 days |
Transatlantic Westbound | Europe to US East Coast | 10 – 20 days |
Intra-Asia | China to Southeast Asia | 3 – 12 days |
Transpacific to US East Coast | Asia to US East Coast (via Canal) | 25 – 35 days |
Beyond the geographic route, the chosen service level directly dictates the processing speed at both the origin and destination ports. The physical handling requirements of your cargo determine how many days are added to the baseline sailing schedule. The logistics industry categorizes these movements based on container utilization.
FCL (Full Container Load): This method offers faster processing. Containers move directly from the shipper's facility to the port terminal and are loaded onto the vessel. Upon arrival, the intact container is discharged to the Container Yard (CY) and made available for immediate drayage pickup.
LCL (Less than Container Load): Cargo must be grouped with other shipments. You must add 5 to 7 days at the origin for the forwarder to receive, consolidate, and load the goods into a shared container at a Container Freight Station (CFS). At the destination, add another 5 to 7 days for the container to be moved to a destination CFS, stripped, and deconsolidated before your specific pallets are available for pickup.
Express Ocean Freight: These premium services utilize faster vessel routing, priority loading, and dedicated terminal gates. Express services shave days off standard FCL transit times, often providing guaranteed equipment and space even during tight capacity markets. They bypass standard terminal congestion by utilizing specialized chassis pools and off-dock yards.
To accurately map your lead times, you must break down the shipment lifecycle into distinct operational phases. Each phase carries its own standard duration and potential for delay.
Origin Inland Transit: Moving empty equipment to the factory, loading the cargo, and returning the full container to the origin port.
Origin Terminal Handling: Gate-in, yard staging, and loading the container onto the vessel.
Ocean Transit: The actual sailing time from the origin port to the destination port, including any transshipment stops.
Destination Terminal Handling: Vessel discharge, yard staging, and customs clearance.
Destination Inland Transit: Dispatching a truck, picking up the container, and delivering it to the final receiving warehouse.
Port to Port Ocean Freight vs. Door to Door Ocean Freight
Breaking down logistics models reveals how they dictate the total time cargo remains out of the shipper's control. The distinction between service scopes determines which party bears the responsibility for inland transit delays, terminal handling, and equipment management.
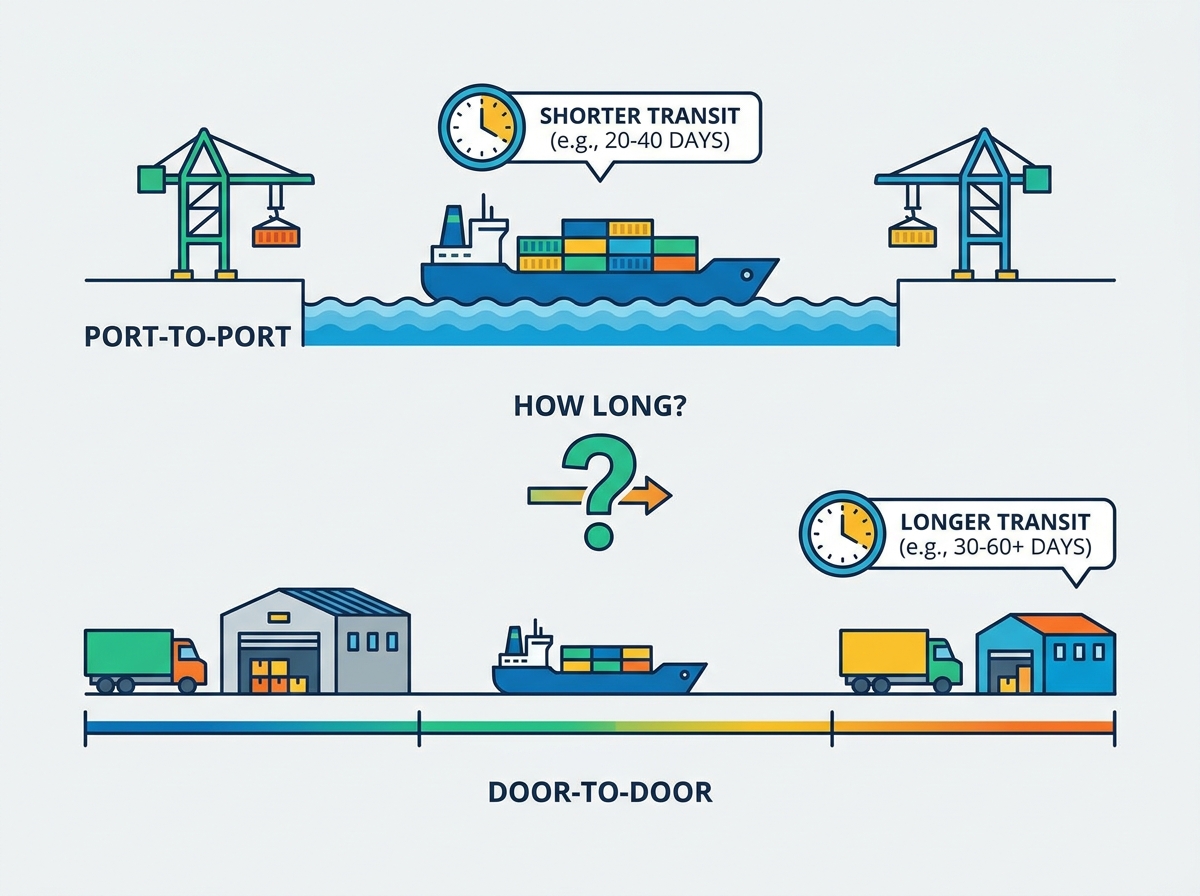
When utilizing port to port ocean freight, the transit time measures only the duration from the origin terminal gate to the destination terminal gate. This model explicitly excludes pre-carriage, which is the inland transport from the factory to the departure port. It also excludes on-carriage, the final delivery from the arrival port to the receiving warehouse. This approach works best for buyers who operate established, highly controlled domestic drayage networks and prefer to manage their own trucking operations.
Managing port-to-port shipments requires the buyer to independently buffer for chassis shortages, local trucking delays, and terminal appointment availability. If the destination port operates on a strict appointment system, like PierPass in Los Angeles and Long Beach, your trucking provider must secure a slot before the container incurs demurrage charges. These administrative hurdles easily add days to the total transit time if not managed aggressively.
Conversely, door to door ocean freight encompasses the entire journey. This model includes factory pickup, export customs clearance, terminal handling, ocean transit, import customs, and final mile delivery. Because it accounts for every physical movement and administrative step, door-to-door service adds 7 to 14 days or more to the standard port-to-port sailing time.
This comprehensive model provides a much more accurate metric for calculating total supply chain lead time. It allows financial controllers to understand exactly how long working capital will be locked up in transit. By placing the responsibility for chassis splits, terminal appointments, and empty container returns on a single logistics provider, shippers reduce the risk of fragmented communication delaying the final delivery.
Key Factors Influencing Ocean Freight Schedules
Assessing the variables that dictate whether a shipment hits the lower end of 10 to 20 days or the upper end of 45 to 55 days requires looking at structural routing decisions and external market forces. Transit times are rarely static. They fluctuate based on carrier network design, seasonal demand surges, and the physical limitations of port infrastructure.
Route complexity plays a massive role in schedule integrity. Direct routing means the container stays on the same vessel from the origin port to the destination port. Transshipment involves transferring cargo between vessels at intermediate hub ports, such as Singapore, Busan, or Jebel Ali. Carriers use transshipment hubs to consolidate cargo from smaller feeder vessels onto massive mother vessels for long-haul ocean crossings.
Transshipments generally add 7 to 10 days to the schedule. They also increase the risk of delays. A missed connection at the hub port forces the container to wait for the next available sailing. If yard density at the transshipment terminal is high, containers can get buried in the stacks, causing them to miss their scheduled loading window entirely.
Peak season and capacity constraints predictably distort transit times every year. The traditional peak season from August to October places immense strain on vessel availability. High cargo volumes push standard 30-day transits to 40 days or more as terminals struggle to process the influx of containers. Pre-holiday rushes, specifically the weeks leading up to Golden Week and Chinese New Year, cause carriers to implement blank sailings.
A blank sailing occurs when a carrier cancels a scheduled port call or an entire voyage. Carriers execute blank sailings to manage capacity and artificially support freight rates when demand drops, or to recover schedules after severe delays. When a sailing is blanked, cargo waits at the origin terminal for an additional week or two until the next vessel arrives.
Port infrastructure and congestion act as severe bottlenecks. Vessel wait times at anchor frequently extend transit times. These delays stem from local labor shortages, chassis deficits, or overwhelming cargo volumes at major global hubs. Ports like Los Angeles, Long Beach, Rotterdam, and Shanghai periodically experience congestion events where vessels wait days or even weeks just to secure a berth. Once berthed, the speed of discharge depends on the number of gantry cranes deployed and the efficiency of the terminal's yard tractors.
Hidden Delays and Implementation Risks in Sea Transit
Identifying common bottlenecks that extend transit times beyond the carrier's published schedule allows you to preempt them. Physical movement is only one part of the equation. Administrative and geopolitical factors frequently derail well-planned shipments, turning a 20-day transit into a 40-day ordeal.
Customs clearance and documentation holds represent the most common source of hidden delays. Inaccurate Commercial Invoices, missing Bills of Lading, or incorrect tariff classifications immediately halt cargo movement. Furthermore, random customs exams introduce unpredictable delays. Customs authorities utilize different levels of inspection based on risk profiles.
NII / X-Ray Exams: The container is driven through a massive X-ray machine. This typically delays the shipment by two to three days.
Tailgate Exams: Customs officers open the doors of the container at the terminal to visually inspect the cargo without unloading it. This adds three to five days.
Intensive Exams: The container is moved to a Centralized Examination Station (CES) and physically unloaded. Officers inspect the individual cartons. This process adds weeks to the transit time and incurs heavy drayage and facility fees.
Rolled cargo is another major implementation risk. Cargo is "rolled" when it is bumped to the next available sailing despite having a confirmed booking. This happens due to vessel overcapacity, weight restrictions, or missed terminal cut-off times. During peak periods, carriers prioritize higher-paying freight or empty container repositioning. Booking three to four weeks in advance during peak seasons and negotiating premium space guarantees with your logistics provider helps prevent your containers from being left on the dock.
Weather events and geopolitical disruptions force sudden, massive alterations to transit schedules. Typhoons in the Pacific frequently force vessels to reduce speed or alter course, adding days to the voyage. Infrastructure limitations, such as draft restrictions in the Panama Canal due to drought, limit vessel capacity and slow down lock transits. Geopolitical rerouting, such as avoiding the Suez Canal and the Red Sea to sail around the Cape of Good Hope, adds 10 to 14 days to Asia-Europe and Asia-US East Coast transit times.
Common Hidden Delays and Estimated Time Impact
Delay Event | Root Cause | Estimated Delay Added |
|---|---|---|
Rolled Cargo | Vessel overcapacity / Missed cut-off | 7 – 14 days |
Customs X-Ray Exam | Random selection / Risk profile | 2 – 4 days |
Customs Intensive Exam | Suspicious cargo / Documentation errors | 10 – 21 days |
Chassis Shortage | Terminal congestion / Equipment imbalance | 3 – 7 days |
Missed Transshipment | Feeder vessel delay / Hub congestion | 7 – 10 days |
Evaluating Ocean Freight vs. Alternative Transport Modes
Balancing the cost-efficiency of sea transport against the speed of alternatives requires a clear understanding of product characteristics and margin profiles. Not all inventory justifies the premium of faster transport. Supply chain managers must segment their SKUs and assign transport modes based on inventory holding costs and market demand volatility.
Aligning transit times with product types and shelf life dictates the optimal transport mode. Bulky, non-perishable, or low-margin goods are perfectly suited for sea transit. These products absorb the 2 to 6 week timeline without degrading product value. Conversely, high-value electronics, perishable pharmaceuticals, or trend-sensitive fashion items often require faster modes to capture market demand before obsolescence.
Comparing sea transit against air freight highlights the primary cost-to-speed matrix. Sea transit averages 20 to 45 days, while air freight typically completes the journey in 3 to 10 days. The decision rests on whether the holding cost of the inventory and the risk of stockouts justify the massive cost premium of air freight. If a factory delay threatens a critical product launch, shifting a portion of the order to air freight preserves the launch date while the bulk of the inventory follows on the water.
Sea-air multimodal solutions bridge the gap between these two extremes. This strategy combines ocean transport to an intermediate hub with air freight to the final destination. A common route involves shipping by sea from Asia to Dubai, then flying the cargo from Dubai to Europe or North America. This hybrid approach achieves transit times of 15 to 20 days. It balances cost and speed effectively for time-sensitive but margin-conscious goods, providing a middle ground when ocean transit is too slow but direct air freight destroys profitability.
Transport Mode Comparison Matrix
Transport Mode | Average Transit Time | Best Suited For |
|---|---|---|
Standard Ocean Freight | 20 – 45 days | High volume, low margin, non-perishable goods. |
Express Ocean Freight | 12 – 20 days | Time-sensitive retail, seasonal inventory. |
Sea-Air Multimodal | 15 – 20 days | Mid-margin goods needing faster-than-ocean delivery. |
Air Freight | 3 – 10 days | High value, highly perishable, emergency stock. |
How to Select Ocean Freight Shipping Services for Schedule Reliability
Establishing criteria for evaluating logistics partners ensures you select providers based on their ability to execute and maintain timeline integrity, rather than just offering the lowest initial rate. The cheapest quote often results in the longest transit times and the highest risk of rolled cargo. You must evaluate the operational infrastructure behind the rate.
Assessing carrier reliability requires looking past published schedules. Evaluate historical on-time performance data for specific trade lanes. Analyze the strength of the carrier's alliance network and their frequency of blank sailings. Carriers that operate direct routes with consistent weekly departures offer much higher schedule reliability than those relying heavily on transshipment hubs. Ask your logistics provider for data on vessel schedule reliability percentages before committing volume.
The role of the freight forwarder is central to navigating these complexities. A forwarder's volume leverage and carrier relationships dictate whether your cargo gets loaded during tight capacity markets. Furthermore, a skilled forwarder provides routing agility. If a major port faces a sudden labor strike, an agile forwarder can reroute your ocean freight shipping services to an alternative gateway, bypassing congested nodes and keeping your supply chain moving.
Technology and tracking capabilities are no longer optional. Utilizing transit time calculators is necessary for initial supply chain forecasting, but execution requires real-time visibility tools. Require your logistics partners to provide API integrations, EDI 315 status messages, and predictive analytics. These tools monitor physical milestones against planned schedules, allowing your team to manage exception handling proactively. If a vessel is delayed by three days, predictive tracking allows you to adjust warehouse labor schedules and notify customers before the delay impacts operations.
Conclusion
Audit your current supply chain lead times by comparing carrier published schedules against actual delivery receipts from the past twelve months.
Map out your exact operational requirements to determine if your infrastructure supports port-to-port control or requires door-to-door management.
Request detailed, route-specific transit breakdowns from vetted logistics partners that explicitly separate sailing days from terminal handling times.
Implement API-driven tracking tools to monitor physical milestones and manage exception handling proactively before delays impact warehouse labor.
FAQ
Q: How long does customs clearance add to ocean freight transit times?
A: Standard customs clearance typically takes one to three days and often occurs concurrently with terminal discharge. If authorities flag the container for a document hold or a physical exam, delays increase. A simple X-ray exam adds two to three days. An intensive physical inspection at a centralized facility can delay cargo by over two weeks.
Q: What is the difference in transit time between FCL and LCL shipments?
A: LCL shipments generally take 10 to 14 days longer than FCL shipments on the same route. This delay accounts for the five to seven days required at the origin port to consolidate multiple shipments into one container, and another five to seven days at the destination port to deconsolidate the cargo before pickup.
Q: Why do door to door ocean freight services take significantly longer than port to port?
A: Door to door services measure the entire supply chain journey. They include the time required for a truck to pick up goods at the factory, transport them to the origin port, and eventually deliver them from the destination port to the final warehouse. These inland trucking legs add 7 to 14 days to the baseline sailing time.
Q: What types of products are best suited for the 20-45 day transit times of ocean freight?
A: Ocean freight is ideal for bulky, heavy, or low-margin goods where transport costs heavily impact profitability. It is best suited for non-perishable items, raw materials, furniture, machinery, and consumer goods with a long shelf life and predictable, steady market demand.
Q: How often do ocean freight shipments get delayed by rolled cargo?
A: Cargo rolling happens frequently during peak shipping seasons from August to October or before major holidays like Chinese New Year. During these periods, carriers face overcapacity and may roll 10% to 20% of booked containers to subsequent sailings, delaying shipments by at least one week.
Q: What are the fastest ocean freight routes available?
A: Intra-Asia routes are the fastest, often taking just 3 to 12 days. For long-haul global trade, the Transatlantic Westbound route from Europe to the US East Coast is relatively fast at 10 to 20 days. Direct Express services from Asia to the US West Coast can also achieve transit times of 12 to 15 days.
Q: How do peak shipping seasons affect ocean freight schedules?
A: Peak seasons strain global port infrastructure and vessel capacity. The surge in cargo volume leads to longer wait times for terminal gates, chassis shortages, and severe vessel congestion at destination ports. This compounding effect routinely adds 7 to 14 days to standard transit schedules.
Related Blogs
-
 Door to door shipping from China simplifies international logistics. But how can you ensure smooth delivery from factory to destination? Choosing the right shipping method, preparing documents, and understanding customs responsibilities are essential. This guide explains each shipping step, compares sea, air, and express services, and clarifies DDP and DAP terms. Learn how to arrange reliable deliveries and avoid unexpected costs.
-
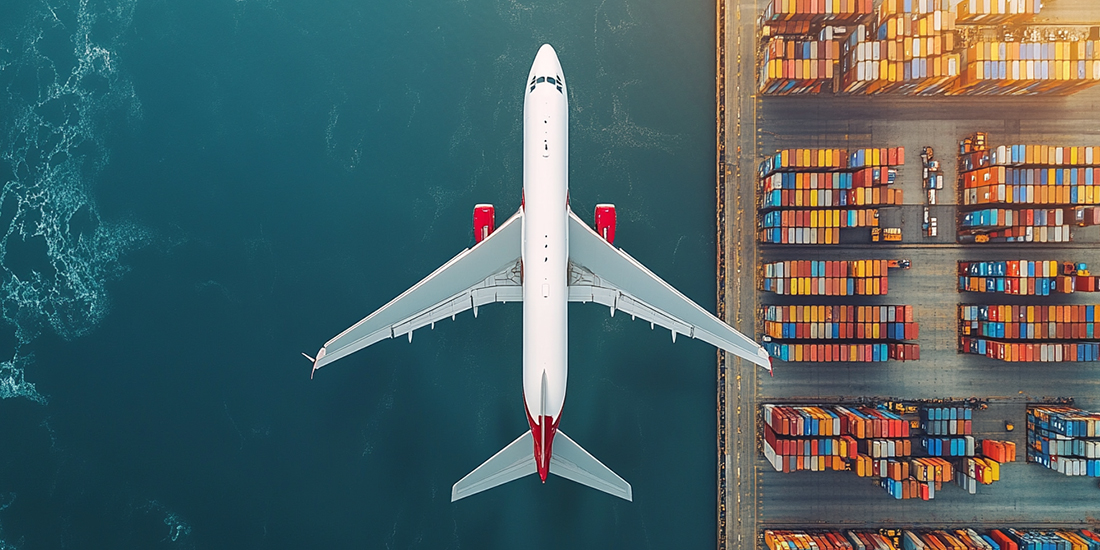 When production stops, every delivery day matters. Delayed components can disrupt schedules and customer commitments. Air freight from China offers a practical solution for urgent commercial shipments. However, choosing the right service requires careful planning. This guide compares standard, priority, and express shipping. You will also learn about flight schedules, customs clearance, and cargo preparation.
-
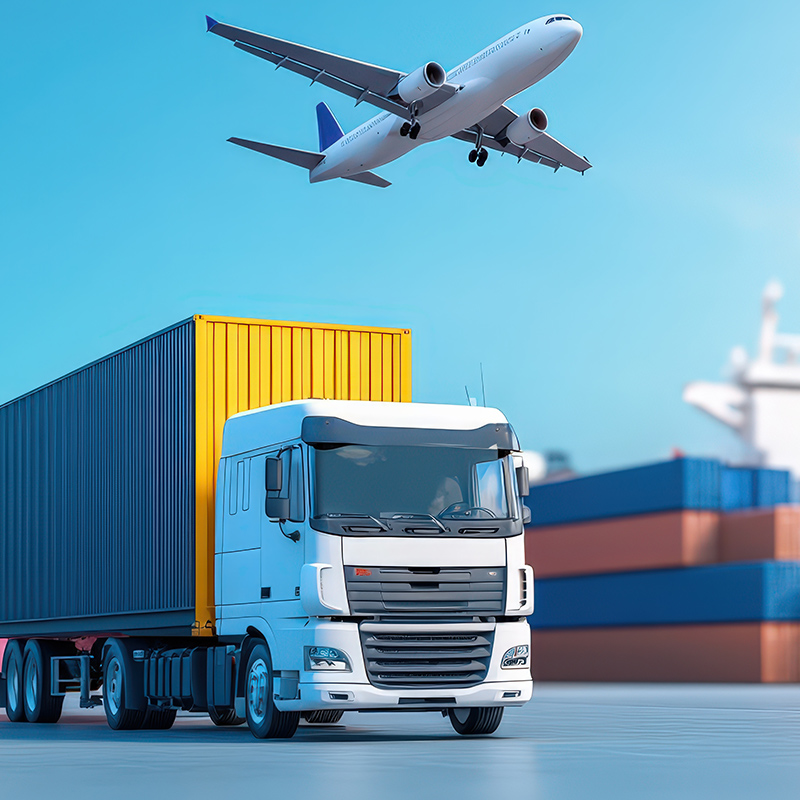 Air freight from China offers speed, but costs can vary significantly. Do you know what determines your final shipping bill? This guide explains air freight cost from China, including per-kilogram rates, chargeable weight, surcharges, and destination fees. Learn how to estimate costs and reduce shipping expenses.
